Official Website: www.odoo.com
Documentation: https://www.odoo.com/documentation/19.0/developer/reference/backend/views.html
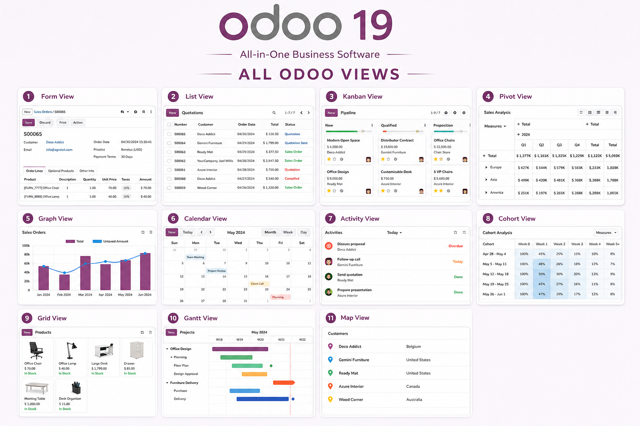
Views are the core components that determine how your data is displayed and interacted with in Odoo. While business objects like customers, products, or invoices are stored in models, views make these records visible, understandable, and actionable. Defined in XML, views control how records appear on the screen and how users interact with them.
In this comprehensive guide, we'll explore all the view types available in Odoo 19 using the Sales module as our practical example. You'll learn how each view works, when to use it, and how to customize it for your specific business needs.
Mastering Odoo views is essential for creating effective business applications. Each view type serves a specific purpose:
| View Type | Purpose | Best Use Case |
|---|---|---|
| Form View | Detailed record editing and creation | Viewing/editing single records |
| List/Tree View | Quick overview and bulk operations | Viewing multiple records in table format |
| Kanban View | Visual workflow and pipeline management | Sales pipeline, project boards |
| Search View | Advanced filtering and grouping | Finding specific records quickly |
| Pivot View | Multi-dimensional data analysis | Sales analysis, financial reporting |
| Graph View | Visual data representation with charts | Performance dashboards, trends |
| Calendar View | Time-based scheduling and planning | Appointments, deadlines, events |
| Activity View | Task and follow-up management | Sales follow-ups, task tracking |
| Cohort View | Track groups of records over time | Retention analysis, subscription tracking |
| Grid View | Spreadsheet-like data editing | Bulk price updates, inventory management |
| Gantt View | Project planning with timeline visualization | Project management, resource allocation |
| Map View | Geographic visualization of records | Logistics, field operations, distribution |
Views in Odoo are XML-defined structures that present data from models in various formats. Each view is stored in the ir.ui.view model. Here's the basic structure:
<record id="model_view_type" model="ir.ui.view">
    <field name="name">view.name</field>
    <field name="model">model.name</field>
    <field name="arch" type="xml">
        <view_type>
            <!-- view content -->
        </view_type>
    </field>
</record>
To make views accessible, you need to register them in a window action:
<record id="action_sale_order" model="ir.actions.act_window">
    <field name="name">Sales Orders</field>
    <field name="res_model">sale.order</field>
    <field name="view_mode">kanban,list,form,pivot,graph,calendar,activity,cohort,grid,gantt,map</field>
    <field name="view_id" ref="view_sale_order_kanban"/>
</record>The Form view displays detailed information about a single record. It organizes fields, sections, and tabs in a structured layout, making it easy to view, edit, or create a record.
<record id="view_sale_order_form_custom" model="ir.ui.view">
    <field name="name">sale.order.form.custom</field>
    <field name="model">sale.order</field>
    <field name="inherit_id" ref="sale.view_order_form"/>
    <field name="arch" type="xml">
        <form>
            <sheet>
                <div class="oe_title">
                    <h1>
                        <field name="name" placeholder="Quotation #"/>
                    </h1>
                    <h3>
                        <field name="state" widget="label_selection"/>
                    </h3>
                </div>
                <group>
                    <group>
                        <field name="partner_id" options="{'no_create': True}"/>
                        <field name="partner_invoice_id" groups="base.group_no_one"/>
                        <field name="partner_shipping_id" groups="base.group_no_one"/>
                        <field name="pricelist_id"/>
                    </group>
                    <group>
                        <field name="date_order"/>
                        <field name="user_id"/>
                        <field name="company_id" groups="base.group_multi_company"/>
                        <field name="origin"/>
                    </group>
                </group>
                <notebook>
                    <page string="Order Lines">
                        <field name="order_line"/>
                    </page>
                    <page string="Other Information">
                        <group>
                            <field name="note"/>
                            <field name="payment_term_id"/>
                        </group>
                    </page>
                </notebook>
            </sheet>
        </form>
    </field>
</record>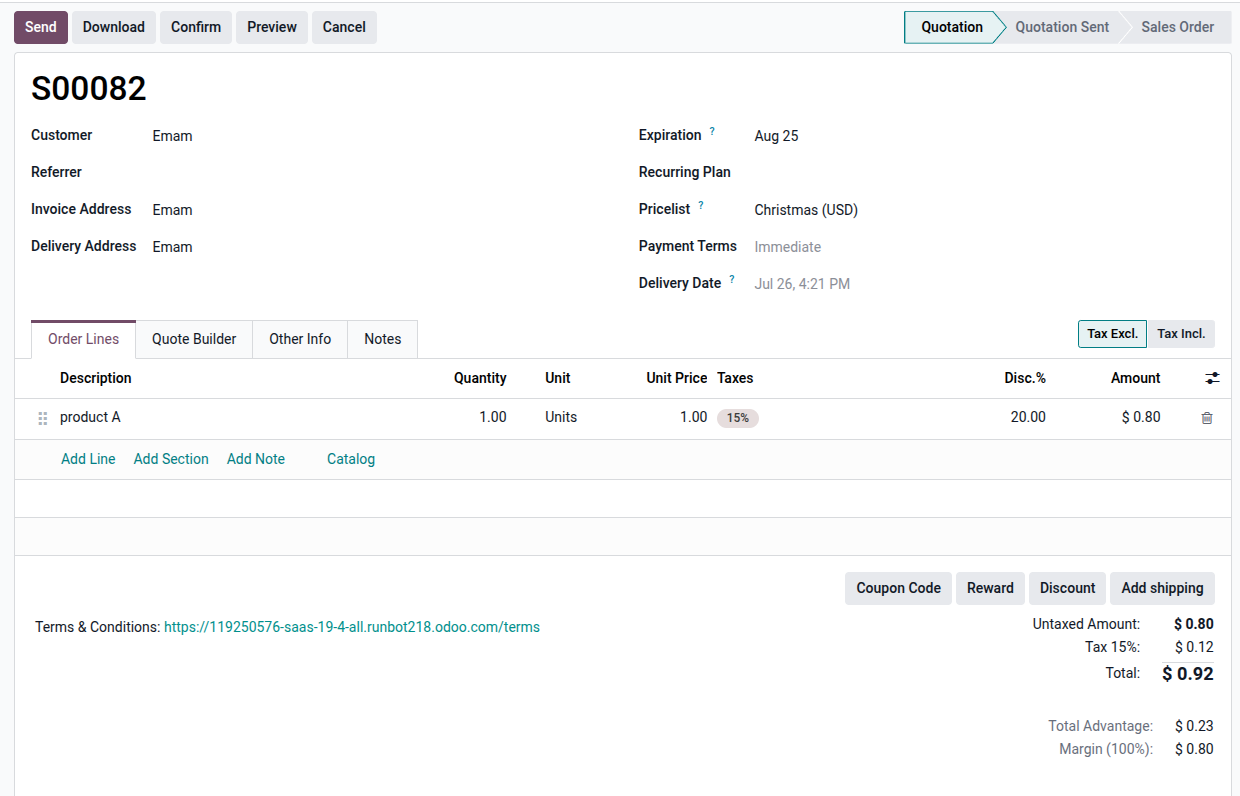
<sheet> – Main container for form content<group> – Organizes fields in columns<notebook> – Creates tabbed sections<page> – Individual tab pages<header> – Button bar at top of form<field> – Individual data fields with attributesThe List view (also called Tree view) displays multiple records in a table format, providing an easy overview and supporting bulk actions.
<record id="view_sale_order_list_custom" model="ir.ui.view">
    <field name="name">sale.order.list.custom</field>
    <field name="model">sale.order</field>
    <field name="arch" type="xml">
        <list string="Sales Orders"
              decoration-success="state == 'sale'"
              decoration-danger="state == 'cancel'"
              decoration-warning="state == 'sent'"
              decoration-info="state == 'draft'"
              editable="bottom"
              multi_edit="1"
              default_group_by="user_id"
              default_order="date_order desc"
              create="0"
              import="0">
            <field name="name"/>
            <field name="partner_id" optional="show"/>
            <field name="date_order"/>
            <field name="amount_untaxed" sum="Total"/>
            <field name="state" widget="label_selection" optional="show"/>
            <field name="user_id" optional="hide"/>
            <field name="company_id" groups="base.group_multi_company" optional="hide"/>
        </list>
    </field>
</record>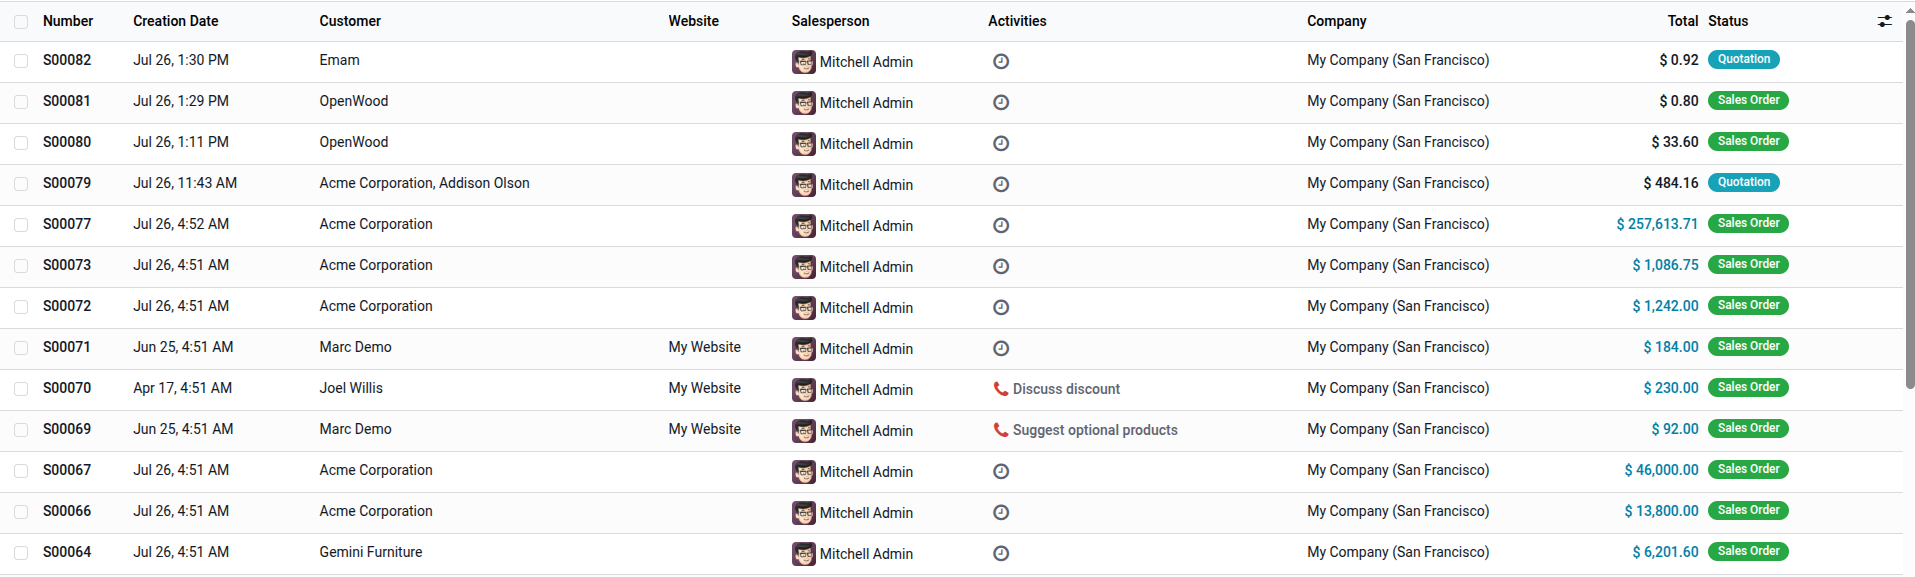
| Attribute | Description |
|---|---|
string | View title |
decoration-* | Color coding rows (success, danger, warning, info) |
editable="bottom" | Enable inline row editing |
multi_edit="1" | Bulk updates on multiple selected records |
default_group_by | Auto-group records by a field |
default_order | Default sorting order |
create="0" | Disable record creation |
delete="0" | Disable record deletion |
import="0" | Disable CSV/XLS import |
limit="80" | Records per page (default 80) |
optional="show" | Make column optional in UI |
The Kanban view displays records as cards, often organized by status or stage, making workflows visual and intuitive. It supports drag-and-drop functionality for updating record status.
<record id="view_sale_order_kanban_custom" model="ir.ui.view">
    <field name="name">sale.order.kanban.custom</field>
    <field name="model">sale.order</field>
    <field name="arch" type="xml">
        <kanban class="o_kanban_mobile"
                default_group_by="state"
                quick_create="true"
                quick_create_view="sale.view_sale_order_form">
            <field name="name"/>
            <field name="state"/>
            <field name="partner_id"/>
            <field name="amount_total"/>
            <field name="date_order"/>
            <field name="user_id"/>
            <field name="pricelist_id"/>
            <progressbar field="state"
                         colors='{"draft": "info", "sent": "warning", "sale": "success", "cancel": "danger"}'
                         invisible="state == 'cancel'"/>
            <templates>
                <t t-name="card">
                    <div class="oe_kanban_global_click">
                        <div class="d-flex justify-content-between">
                            <strong><field name="name"/></strong>
                            <field name="state" widget="label_selection"/>
                        </div>
                        <div class="mt-2">
                            <div><i class="fa fa-user"/> <field name="partner_id"/></div>
                            <div><i class="fa fa-calendar"/> <field name="date_order"/></div>
                            <div><i class="fa fa-money"/> <field name="amount_total"/></div>
                            <div><i class="fa fa-user"/> <field name="user_id"/></div>
                        </div>
                    </div>
                </t>
            </templates>
        </kanban>
    </field>
</record>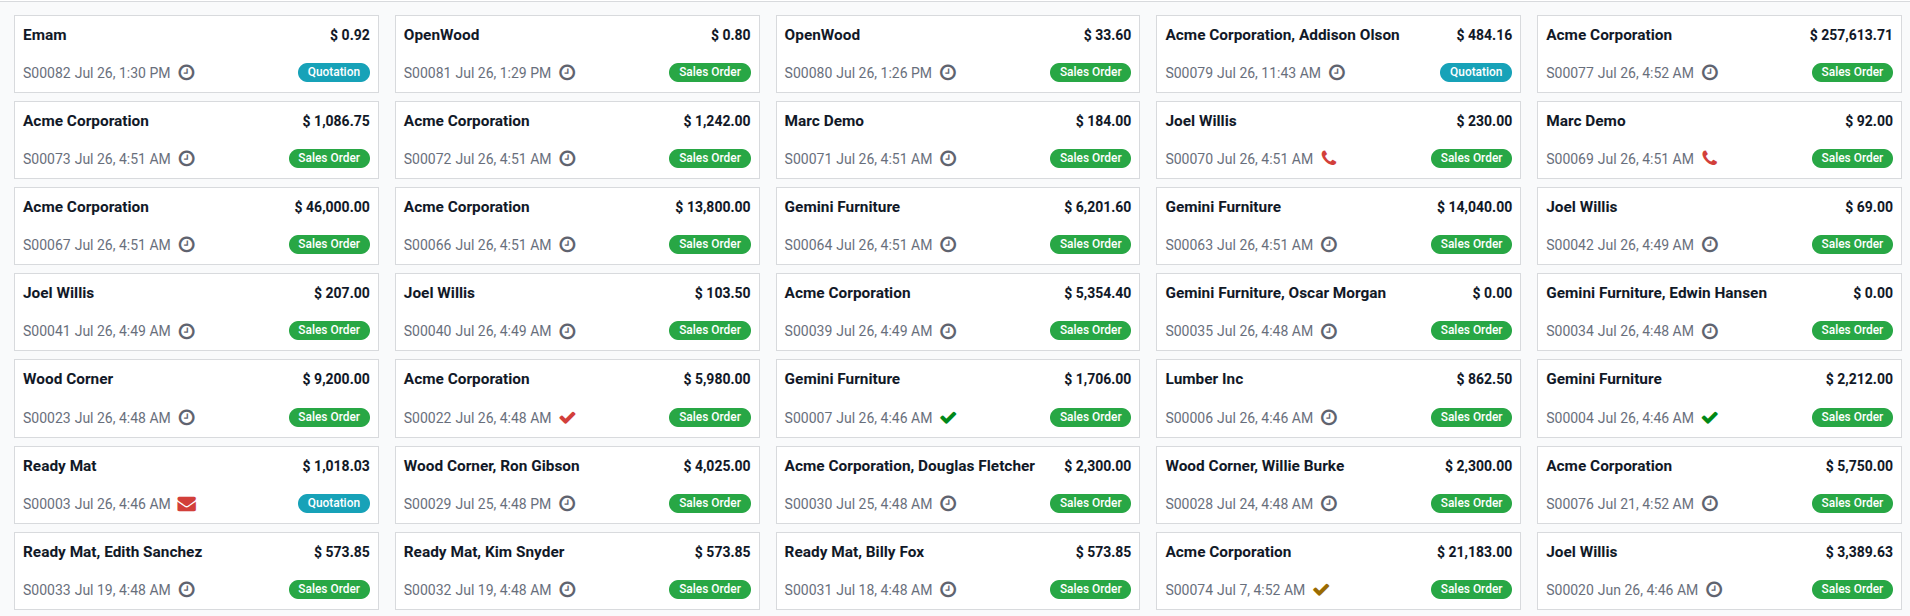
default_group_by – Default grouping field for cardsquick_create – Enable inline record creationquick_create_view – Form view used for quick creation<progressbar> – Visual progress indicatorThe Search view helps users quickly locate records using filters, grouping, or keyword searches. It appears at the top of list, kanban, and other views.
<record id="view_sale_order_search_custom" model="ir.ui.view">
    <field name="name">sale.order.search.custom</field>
    <field name="model">sale.order</field>
    <field name="arch" type="xml">
        <search string="Search Sales Orders">
            <field name="name" string="Order Number"/>
            <field name="partner_id" string="Customer"/>
            <field name="user_id" string="Salesperson"/>
            <field name="date_order" string="Order Date"/>

            <filter string="My Orders"
                    name="my_orders"
                    domain="[('user_id','=',uid)]"/>

            <filter string="Draft"
                    name="draft_orders"
                    domain="[('state','=','draft')]"/>

            <filter string="Sent"
                    name="sent_orders"
                    domain="[('state','=','sent')]"/>

            <filter string="Confirmed"
                    name="confirmed_orders"
                    domain="[('state','=','sale')]"/>

            <separator/>

            <filter string="This Month"
                    name="this_month"
                    domain="[('date_order','>=', context_today().strftime('%Y-%m-01'))]"/>

            <separator/>

            <group expand="1" string="Group By">
                <filter string="Salesperson"
                        name="group_user"
                        context="{'group_by': 'user_id'}"/>
                <filter string="Customer"
                        name="group_partner"
                        context="{'group_by': 'partner_id'}"/>
                <filter string="State"
                        name="group_state"
                        context="{'group_by': 'state'}"/>
                <filter string="Date"
                        name="group_date"
                        context="{'group_by': 'date_order'}"/>
            </group>
        </search>
    </field>
</record>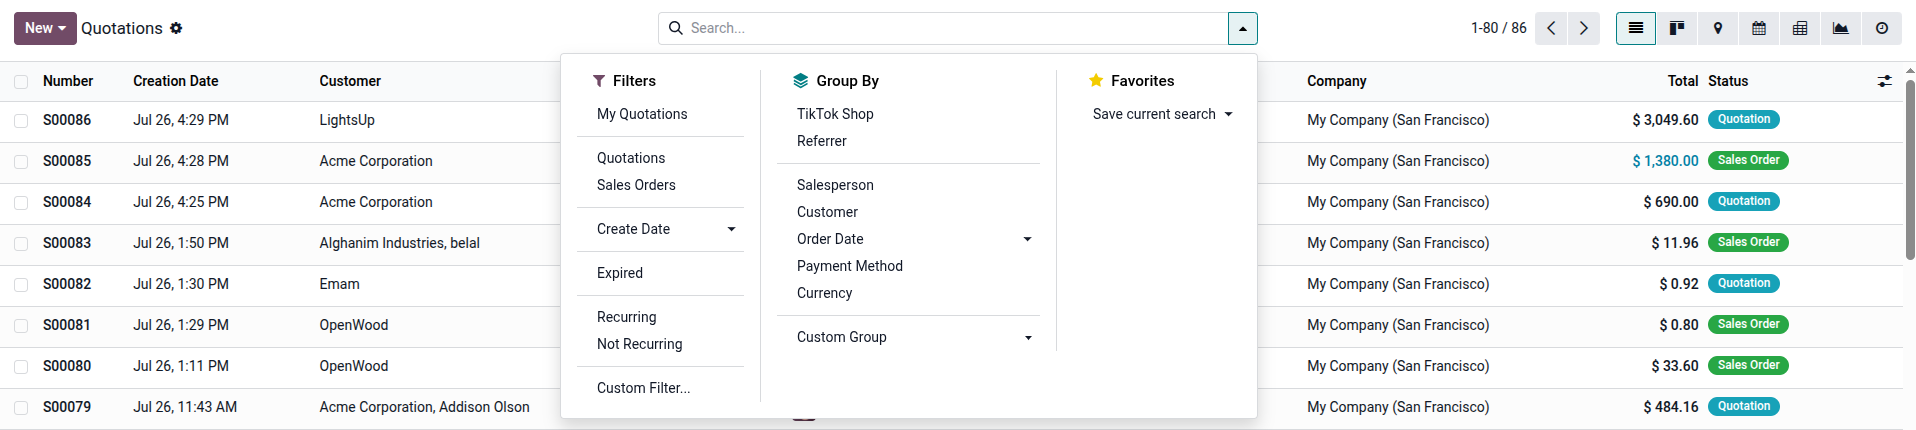
<field> – Searchable fields<filter> – Predefined filters with domain<group> – Grouping options with context<separator/> – Visual separation between filtersThe Pivot view summarizes large datasets into a structured table with totals, averages, counts, and other aggregations. It's ideal for sales reports, financial analysis, and inventory tracking.
<record id="view_sale_order_pivot_custom" model="ir.ui.view">
    <field name="name">sale.order.pivot.custom</field>
    <field name="model">sale.order</field>
    <field name="arch" type="xml">
        <pivot string="Sales Analysis"
               default_order="date_order desc"
               sample="1">
            <field name="date_order" type="row"/>
            <field name="user_id" type="row"/>
            <field name="partner_id" type="col"/>
            <field name="state" type="col"/>
            <field name="amount_untaxed" type="measure" operator="sum"/>
            <field name="amount_total" type="measure" operator="sum"/>
            <field name="order_line" type="measure" operator="count"/>
        </pivot>
    </field>
</record>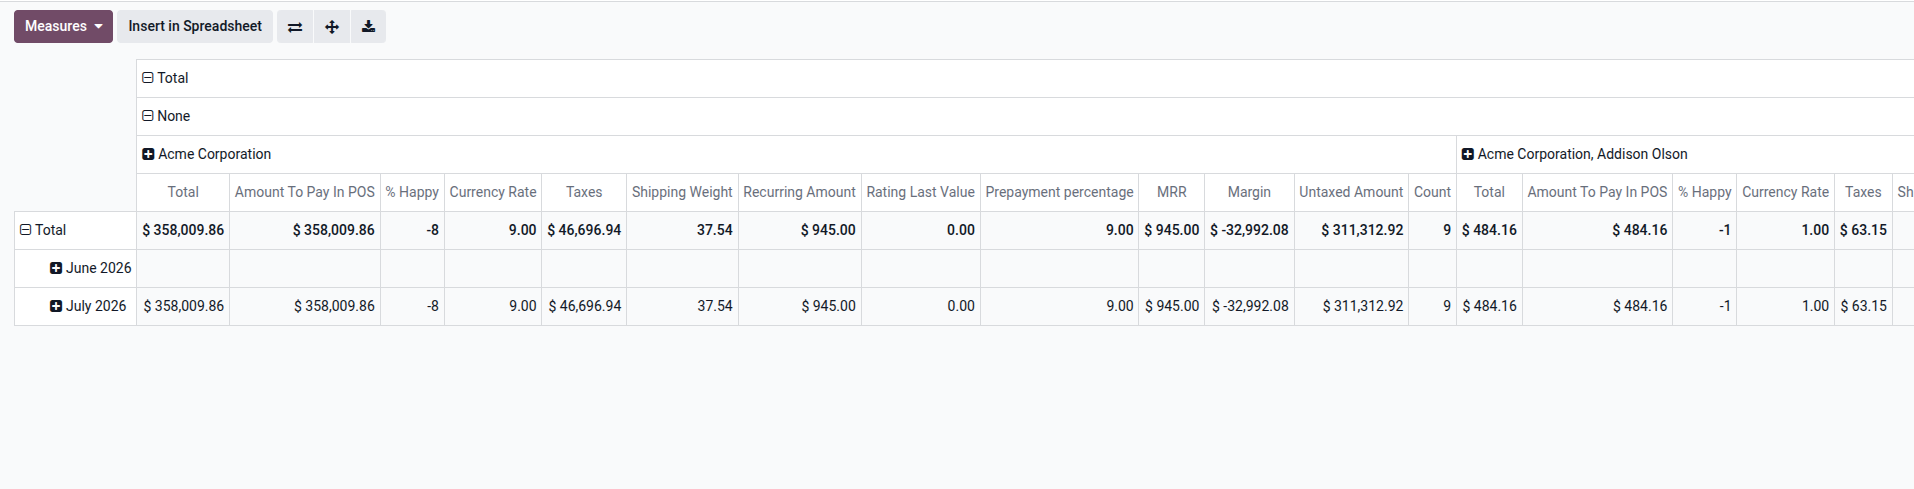
type="row" – Fields displayed as rowstype="col" – Fields displayed as columnstype="measure" – Fields with aggregationsoperator – Aggregation function (sum, count, avg, min, max)The Graph view visualizes data with charts, supporting bar charts, pie charts, and line graphs to help users quickly understand data patterns.
<record id="view_sale_order_graph_custom" model="ir.ui.view">
    <field name="name">sale.order.graph.custom</field>
    <field name="model">sale.order</field>
    <field name="arch" type="xml">
        <graph string="Sales Performance"
               type="bar"
               sample="1">
            <field name="date_order" type="row"/>
            <field name="user_id" type="col"/>
            <field name="amount_total" type="measure" operator="sum"/>
            <field name="order_line" type="measure" operator="count"/>
        </graph>
    </field>
</record>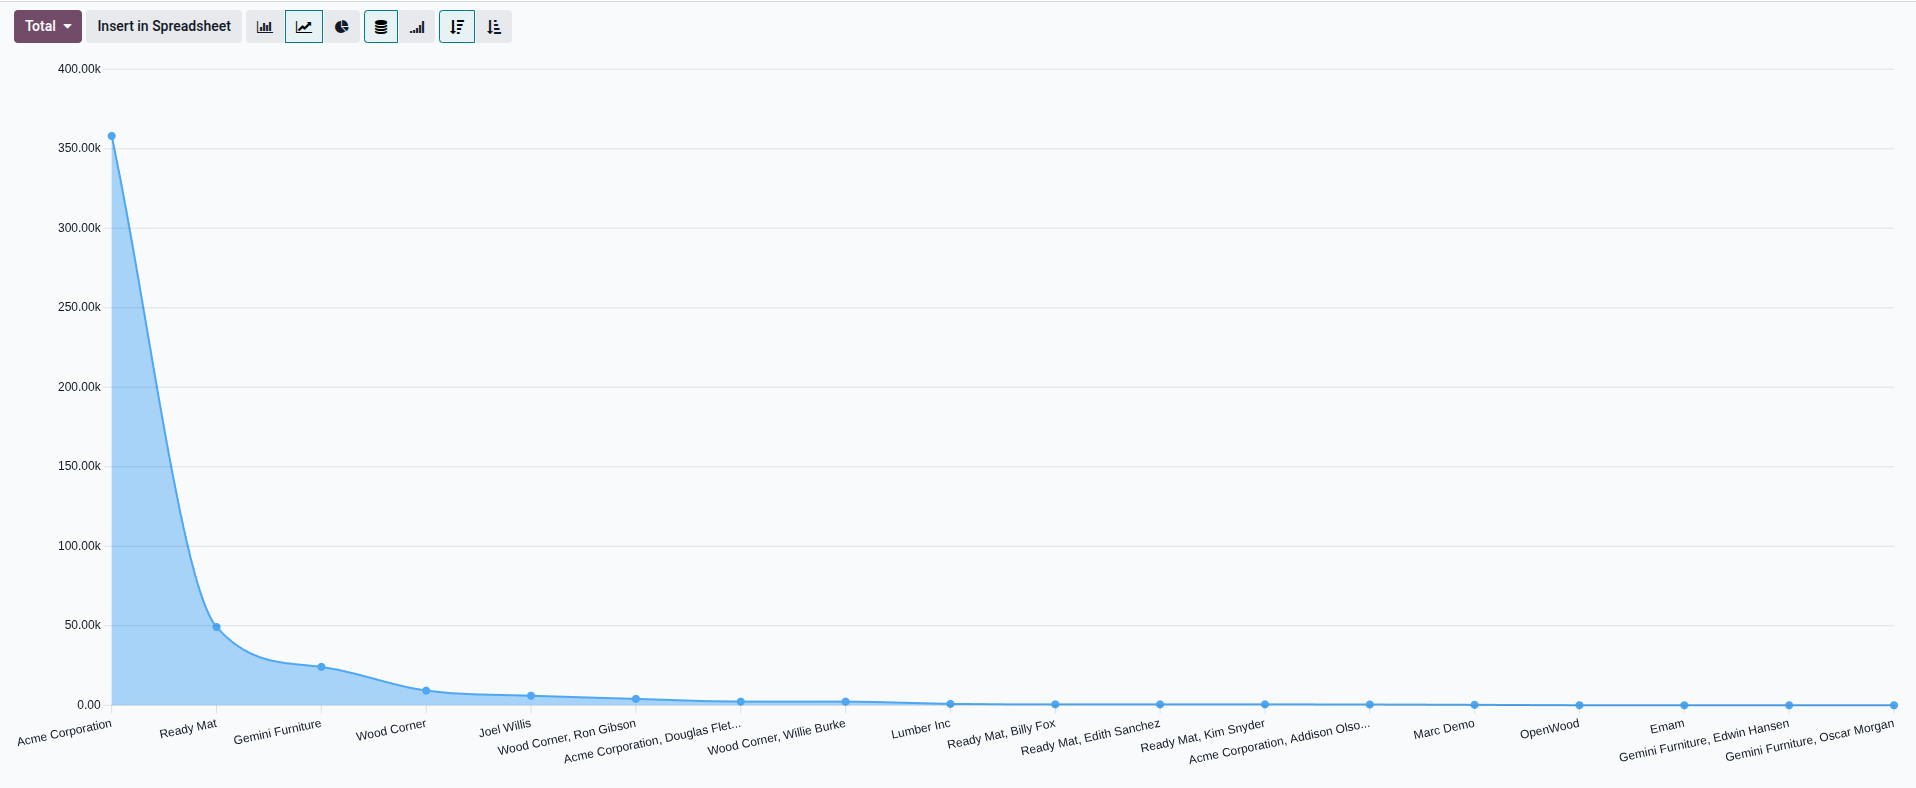
type="bar" – Bar chart (default)type="pie" – Pie charttype="line" – Line graphstacked="True" – Stacked bar chartThe Calendar view organizes records by dates, providing a visual schedule of activities, appointments, or project timelines.
<record id="view_sale_order_calendar_custom" model="ir.ui.view">
    <field name="name">sale.order.calendar.custom</field>
    <field name="model">sale.order</field>
    <field name="arch" type="xml">
        <calendar string="Sales Calendar"
                  date_start="date_order"
                  date_stop="date_order"
                  color="user_id"
                  mode="month"
                  quick_add="true"
                  event_open_popup="true">
            <field name="name"/>
            <field name="partner_id"/>
            <field name="user_id"/>
            <field name="state"/>
            <field name="amount_total"/>
        </calendar>
    </field>
</record>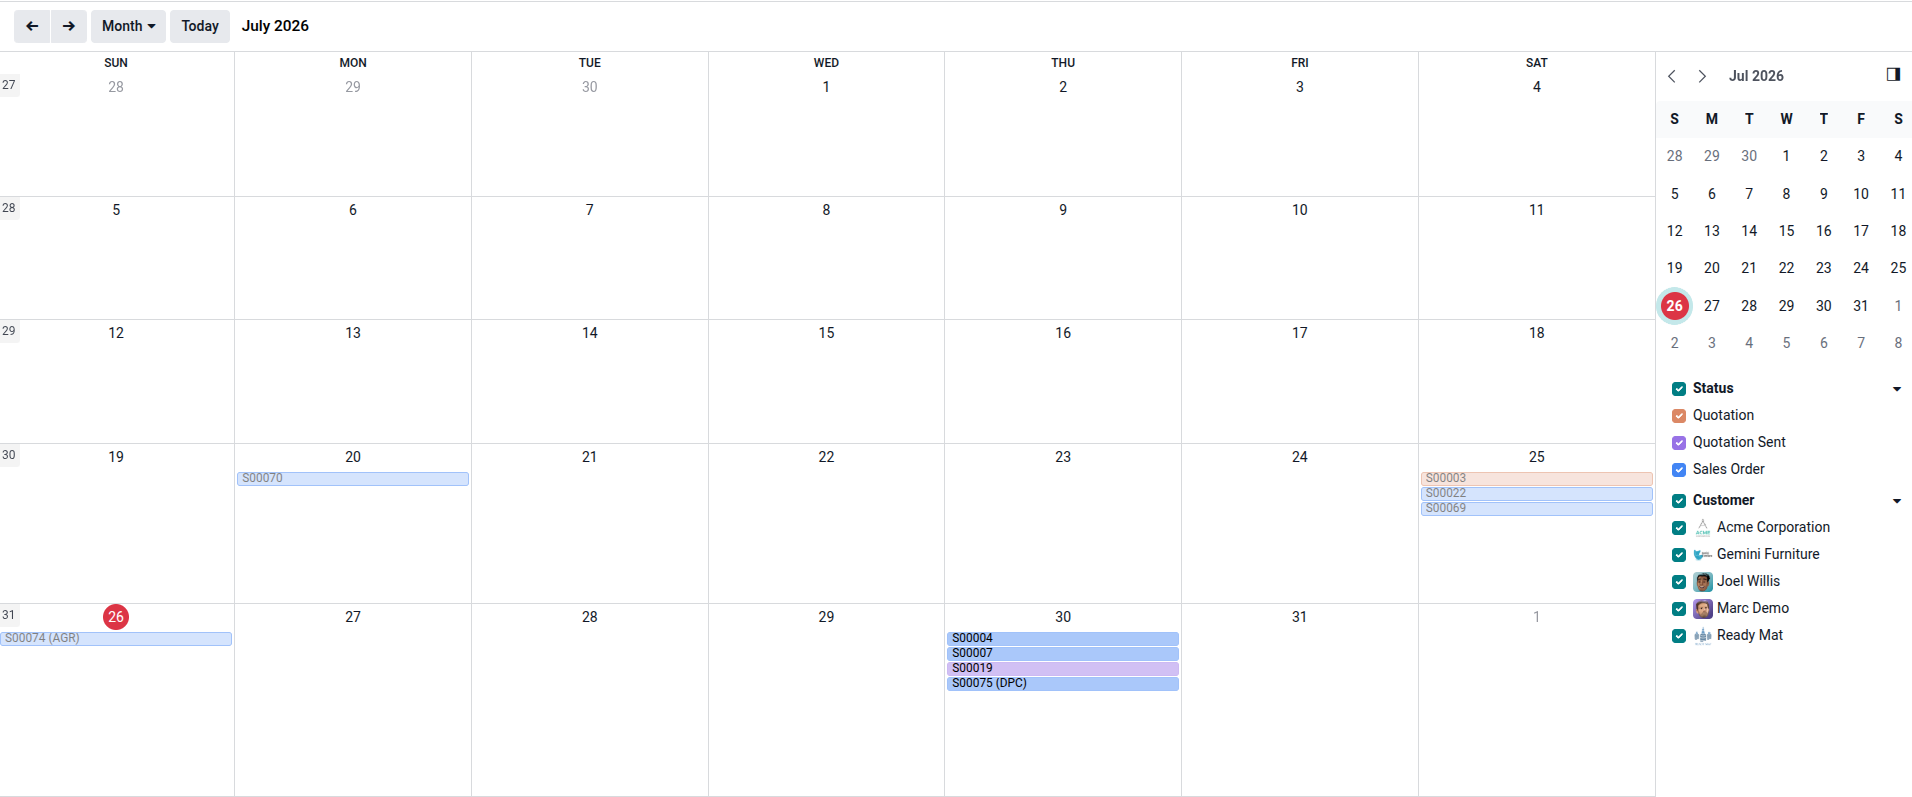
date_start – Start date field for eventsdate_stop – End date field for eventscolor – Field used to color-code eventsmode – Default display mode (day/week/month)quick_add – Enable quick event creationevent_open_popup – Open popup for eventsThe Activity View shows all planned actions (calls, tasks, meetings) for a record, helping manage follow-ups and scheduling.
<record id="view_sale_order_activity_custom" model="ir.ui.view">
    <field name="name">sale.order.activity.custom</field>
    <field name="model">sale.order</field>
    <field name="arch" type="xml">
        <activity string="Activities">
            <field name="activity_type_id"/>
            <field name="date_deadline"/>
            <field name="summary"/>
            <field name="user_id"/>
            <field name="partner_id"/>
            <field name="state"/>
            <field name="sale_order_id"/>
        </activity>
    </field>
</record>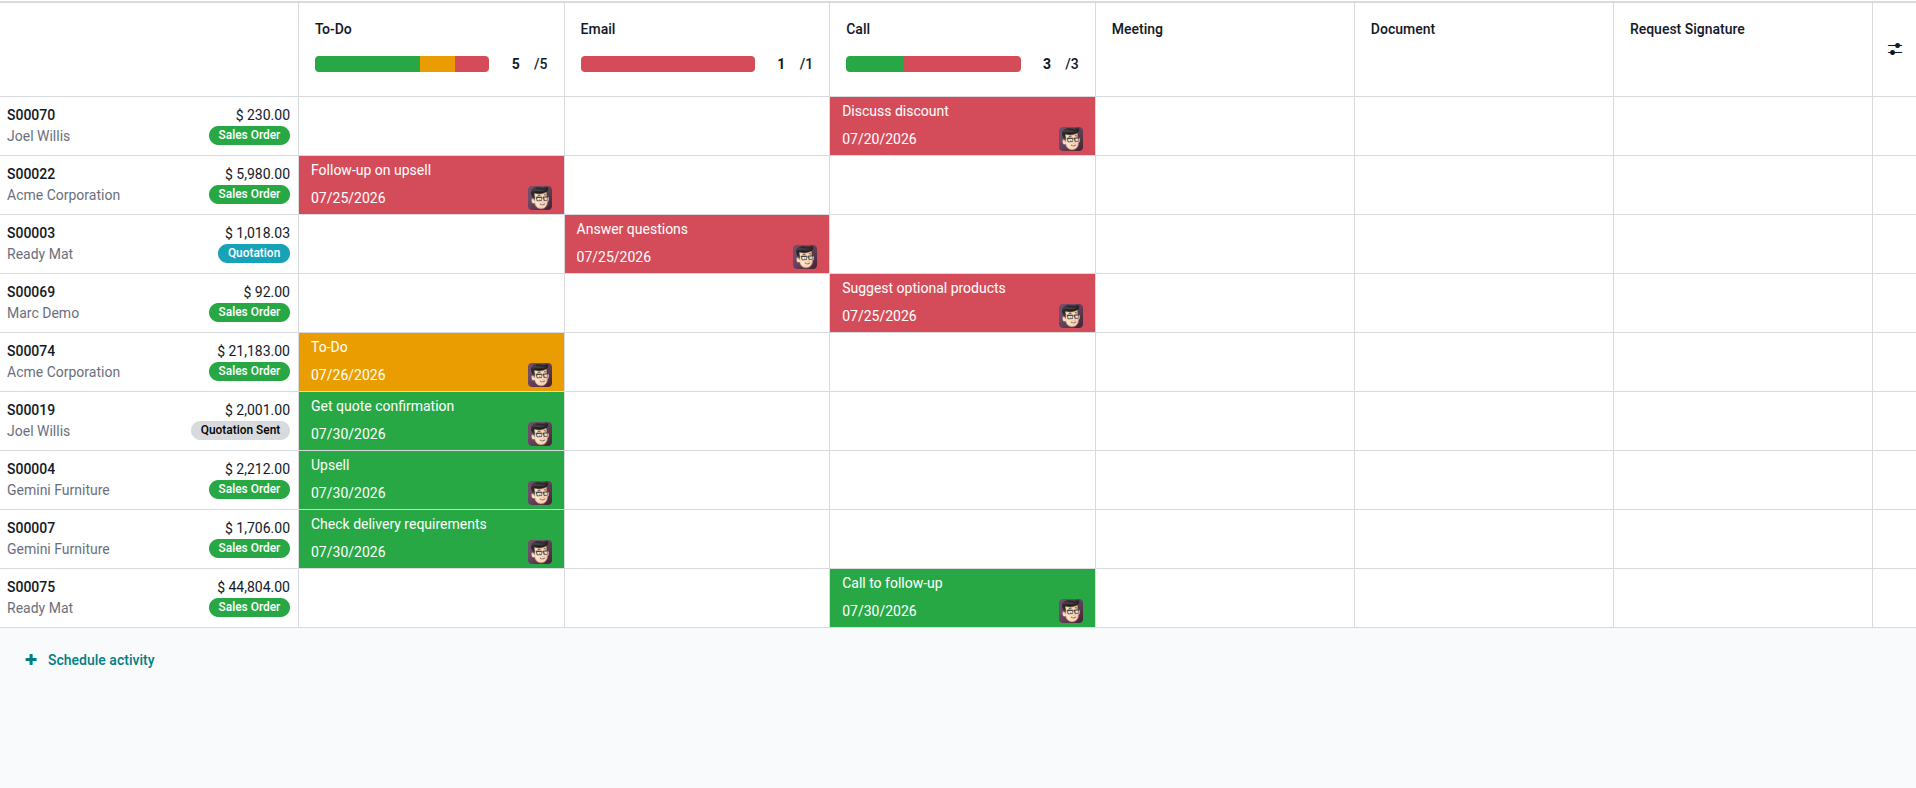
The Cohort view tracks groups of records over time, showing retention, churn, or engagement patterns. It's perfect for subscription-based businesses and customer retention analysis.
<record id="view_sale_order_cohort_custom" model="ir.ui.view">
    <field name="name">sale.order.cohort.custom</field>
    <field name="model">sale.order</field>
    <field name="arch" type="xml">
        <cohort string="Sales Cohort Analysis"
                period="month"
                date_start="date_order"
                mode="churn">
            <field name="partner_id" type="row"/>
            <field name="user_id" type="col"/>
            <field name="amount_total" type="measure" operator="sum"/>
        </cohort>
    </field>
</record>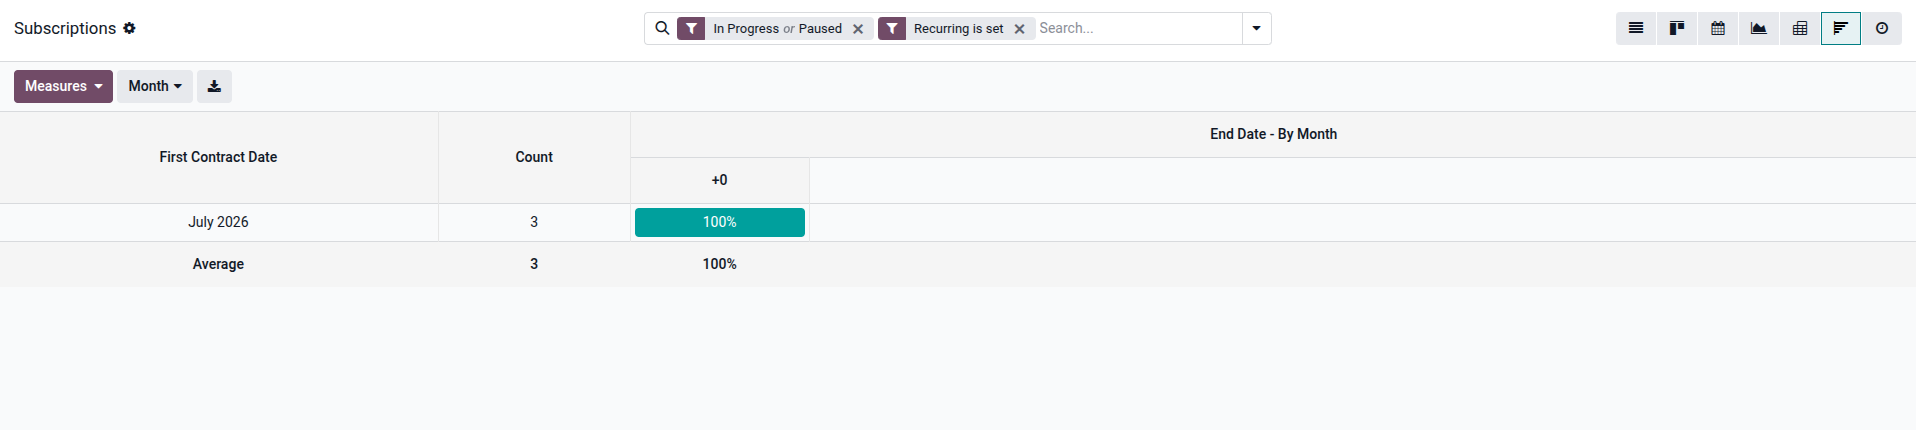
period – Time period (day, week, month, quarter, year)date_start – Start date field for cohort analysismode – Analysis mode (churn, retention, sum, max, min)timeline – Date field for timeline trackingThe Grid view provides a spreadsheet-like interface for editing records in bulk. It's ideal for scenarios like updating product prices, inventory levels, or configuring multiple items simultaneously.
<record id="view_sale_order_grid_custom" model="ir.ui.view">
    <field name="name">sale.order.grid.custom</field>
    <field name="model">sale.order</field>
    <field name="arch" type="xml">
        <grid string="Sales Order Grid">
            <field name="name"/>
            <field name="partner_id" editable="true"/>
            <field name="date_order" editable="true"/>
            <field name="amount_total" editable="true"/>
            <field name="state" readonly="true"/>
            <field name="user_id" editable="true"/>
        </grid>
    </field>
</record>
editable="true" – Make field editable in gridreadonly="true" – Make field read-onlyvalid_columns – Valid column definitionsvalid_rows – Valid row definitionsThe Gantt view visualizes project tasks, milestones, and dependencies on a timeline, making it essential for project management and resource planning.
<record id="view_sale_order_gantt_custom" model="ir.ui.view">
    <field name="name">sale.order.gantt.custom</field>
    <field name="model">sale.order</field>
    <field name="arch" type="xml">
        <gantt string="Project Timeline"
               date_start="date_order"
               date_stop="date_order"
               color="user_id"
               default_group_by="user_id"
               progress="amount_total / 100">
            <field name="name"/>
            <field name="partner_id"/>
            <field name="user_id"/>
            <field name="state"/>
            <field name="amount_total"/>
        </gantt>
    </field>
</record>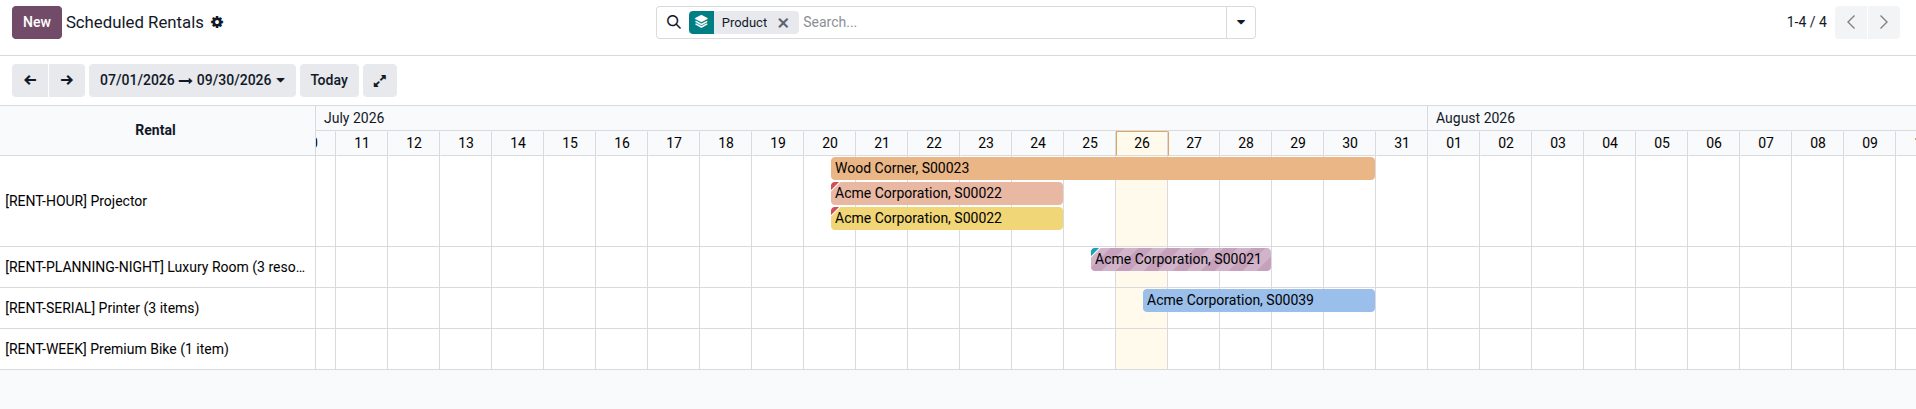
date_start – Start date for tasksdate_stop – End date for taskscolor – Color-coding fieldprogress – Progress calculation expressiondefault_group_by – Default groupingscale – Time scale (day, week, month, year)The Map view displays records on a geographic map, visualizing locations for logistics, field operations, distribution, or customer mapping.
<record id="view_sale_order_map_custom" model="ir.ui.view">
    <field name="name">sale.order.map.custom</field>
    <field name="model">sale.order</field>
    <field name="arch" type="xml">
        <map string="Sales Locations"
             res_partner="partner_id">
            <field name="partner_id"/>
            <field name="amount_total"/>
            <field name="date_order"/>
            <field name="state"/>
        </map>
    </field>
</record>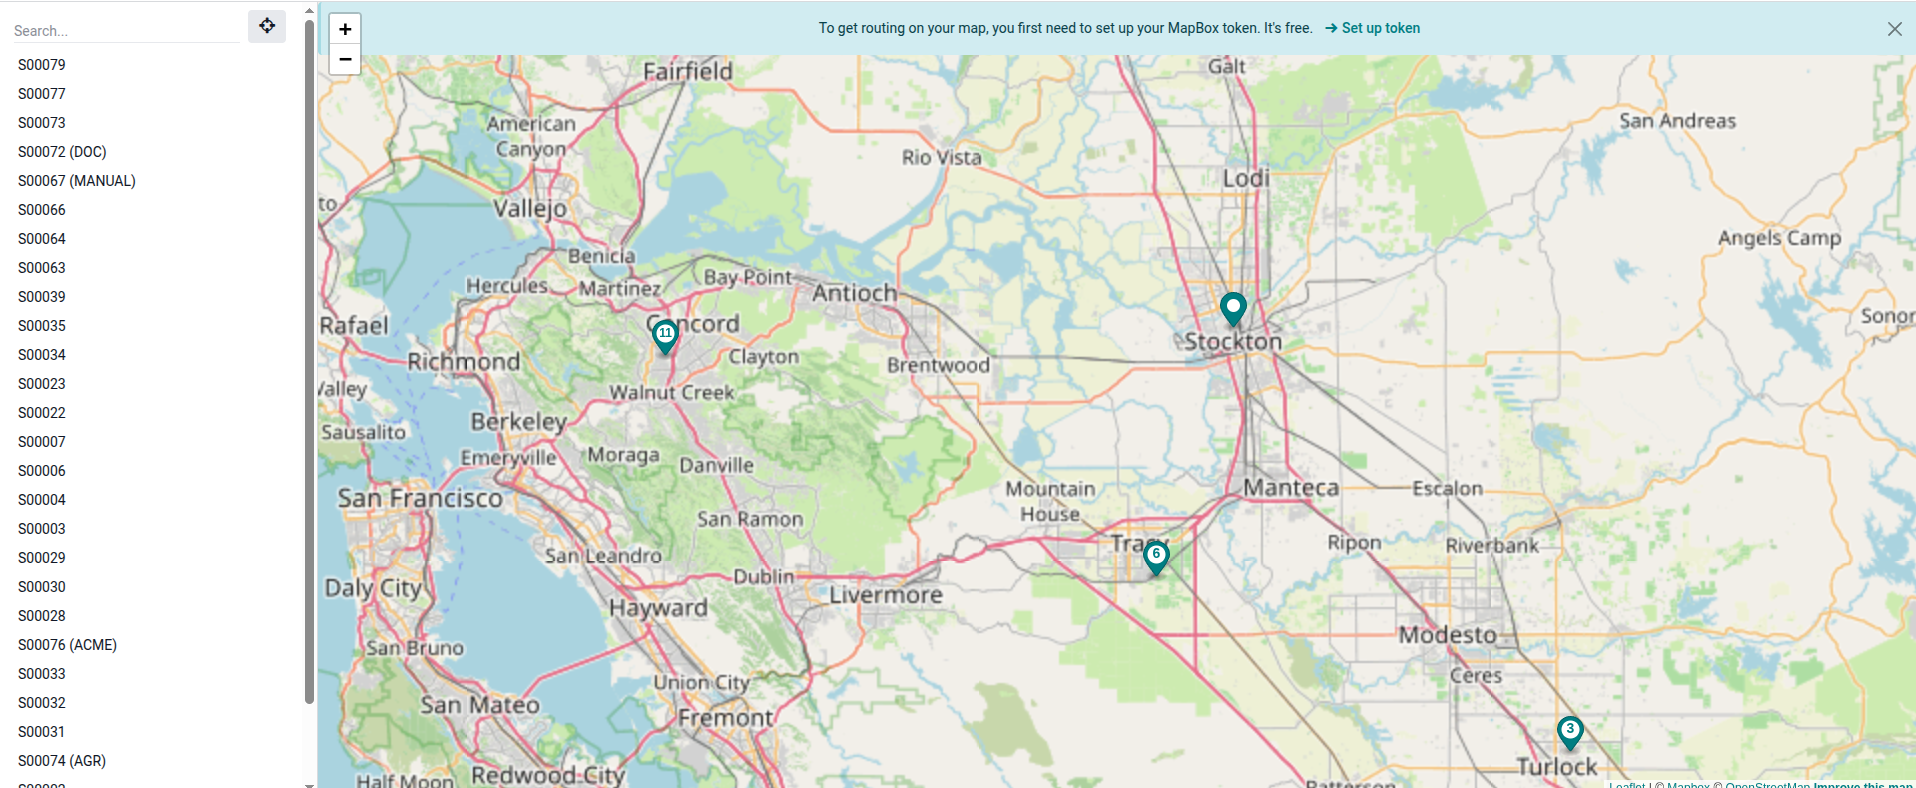
res_partner – Partner field with address datafield_name – Field containing location datalatitude – Latitude field (if not using res_partner)longitude – Longitude field (if not using res_partner)cluster – Enable clustering of markersView inheritance is the most frequent method for customizing Odoo's user interface. It allows you to modify existing views by adding new elements, changing attributes, or removing elements.
<record id="view_sale_order_inherit_custom" model="ir.ui.view">
    <field name="name">sale.order.inherit.custom</field>
    <field name="model">sale.order</field>
    <field name="inherit_id" ref="sale.view_order_form"/>
    <field name="arch" type="xml">
        <!-- Add new field -->
        <xpath expr="//field[@name='partner_id']" position="after">
            <field name="custom_field" string="Custom Field"/>
        </xpath>

        <!-- Add custom button -->
        <xpath expr="//header" position="inside">
            <button name="custom_action"
                    string="Custom Button"
                    class="btn-primary"
                    type="object"/>
        </xpath>

        <!-- Add new tab -->
        <xpath expr="//notebook" position="inside">
            <page string="Custom Tab">
                <group>
                    <field name="custom_field_1"/>
                    <field name="custom_field_2"/>
                </group>
            </page>
        </xpath>

        <!-- Modify field attribute -->
        <xpath expr="//field[@name='name']" position="attributes">
            <attribute name="readonly">1</attribute>
            <attribute name="string">Order Number</attribute>
        </xpath>
    </field>
</record>| Position | Description |
|---|---|
before | Insert before matched element |
after | Insert after matched element |
inside | Insert within matched element |
replace | Replace matched element |
attributes | Modify attributes of matched element |
Context is a Python dictionary that passes temporary information to views, allowing dynamic behavior and default values.
<!-- Set default values -->
<field name="context">
    {'default_partner_id': active_id, 'default_state': 'draft'}
</field>

<!-- Apply default filters in search view -->
<field name="context">
    {'search_default_my_orders': 1, 'search_default_draft_orders': 1}
</field>

<!-- Auto-group in views -->
<field name="context">
    {'group_by': 'user_id'}
</field>

<!-- Pass partner context -->
<button name="%(action_sale_order)d"
        type="action"
        context="{'partner_id': active_id}"/>
Mastering Odoo views is essential for creating effective business applications. Each view type serves a specific purpose:
By understanding how to define, customize, and use these views with the Sales module, you can create powerful and intuitive user interfaces for any business requirement.